Understanding an Audiogram and Your Home-Check Graph
Read chart axes and symbols, distinguish professional audiograms from relative home results and prepare useful questions.
An educational guide from Online Hearing Test. Sources linked throughout.
First, check which kind of graph you have
A professional audiogram records results from a hearing assessment. Our website’s home-check graph records responses at relative playback settings. They can look similar, but their numbers are not interchangeable. ASHA’s audiogram guide describes the professional chart.
If your graph came from this website, read the relative-level labels and the response table. Do not apply a clinical hearing-loss scale to it. Comfortable headphone setup does not calibrate the sound reaching your ears, and our graph cannot establish normal hearing or grade a loss.
Read the axes and symbols
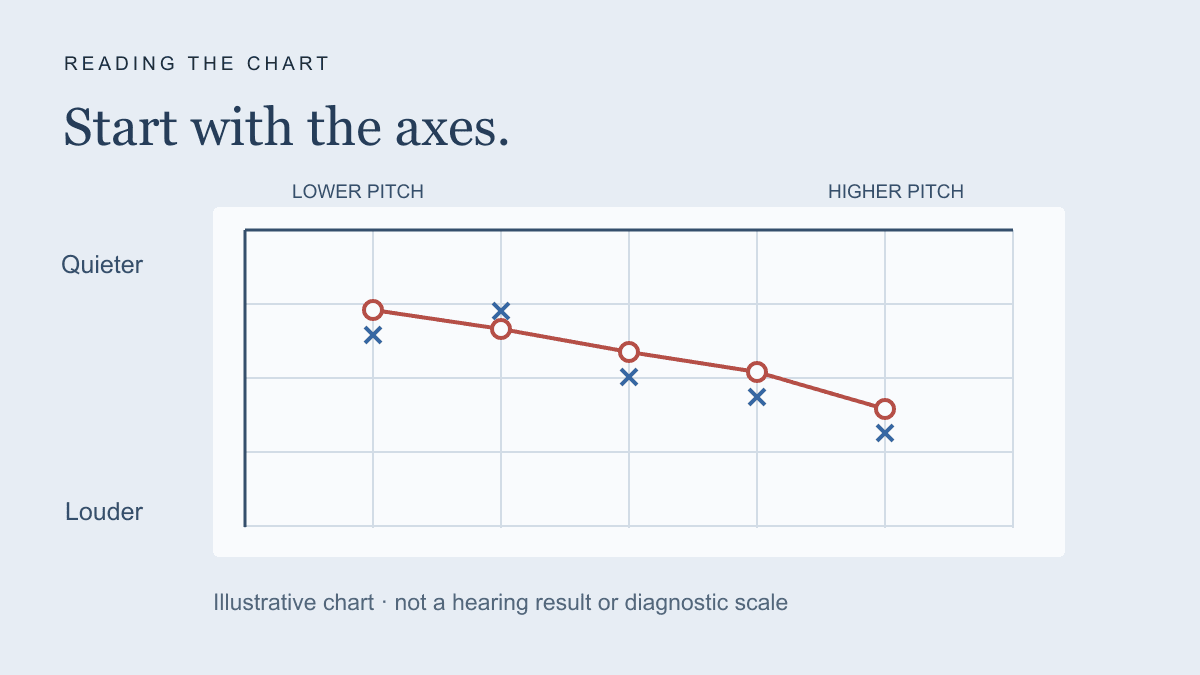
On a conventional audiogram, frequency runs from lower pitches on the left to higher pitches on the right. Louder presentation levels appear farther down the chart. Red circles usually represent the right ear and blue crosses the left. ASHA explains these conventions and the chart’s meaning.
Always use the legend supplied with your own report. If there are extra symbols, arrows or annotations, ask what each represents instead of assuming every mark is an exact measured value. A line joining points helps you follow the pattern; it does not add measurements between the tested pitches.
Interpretation needs the rest of the assessment
An audiologist may use several tests alongside a history of your concerns. The NHS describes pure-tone testing, speech testing and tympanometry among the possible parts of an appointment. Read what happens during a hearing test.
Useful questions include: Which tests are shown here? Are any results uncertain or limited by the equipment? How do these findings relate to the situations I find difficult? Is further assessment recommended? Ask for a copy of the report and an explanation of unfamiliar terms.
A shape on a graph is not a reliable basis for diagnosing yourself or choosing a device. Our optional AI explanation also cannot supply that missing clinical interpretation. It receives home-check observations, not a complete assessment.
Understand the limits on our graph
A response point means a response was recorded at that relative setting under this check’s confirmation rules. An upward arrow means responses reached the quietest available setting; a downward arrow marks no confirmed response within the available range. Neither arrow is an exact threshold.
Inconclusive results have no assigned number. Question marks below the graph identify these pitches, with an option to repeat them individually or together. Headphone response, room noise, device volume and sound crossing between ears can affect the pattern. Differences between home sessions cannot establish a clinical change.
Keep the graph in perspective
You can try our free hearing check and download its graph and table without an account or payment. A free optional AI explanation requires consent to send responses to Our AI; it explains the observations without diagnosing, grading hearing loss or comparing age norms.
Persistent listening concerns deserve professional attention regardless of any home result. For sudden hearing loss, seek medical attention immediately rather than waiting to compare graphs. NIDCD’s guidance explains the urgency.